LD50 Lab
HYPOTHESIS: The seeds with a concentration of salt being 25 or lower will germinate fastest.
VARIABLES
Independent: Salt Concentration
Dependent: Radical Length
Control: 0% Salt Concentration
PROBLEM: Determine how radish seeds will respond to various concentrations of salt.
MATERIALS: .6 petri dishes
6 seeds
12 napkins
Water
Graduated cylinder
Concentrated Salt Water solution
PROCEDURE:
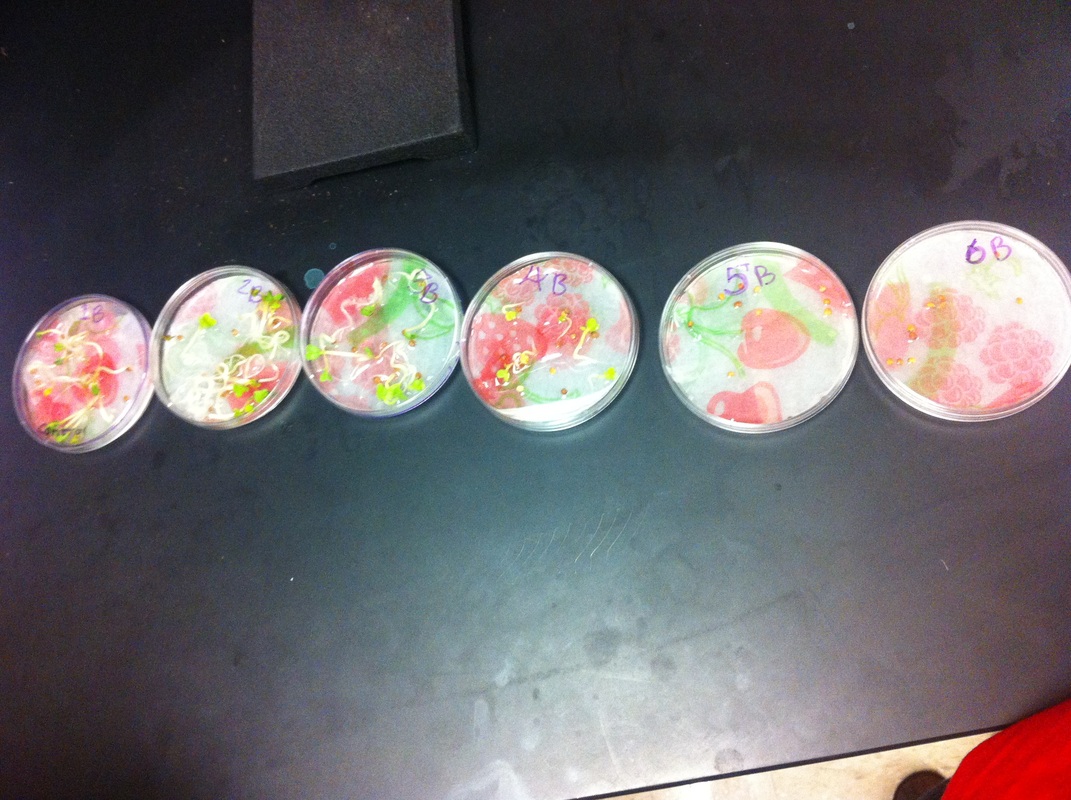
1. Label all six petri dishes with your group number, the dish #, and a percent concentration of chemical:
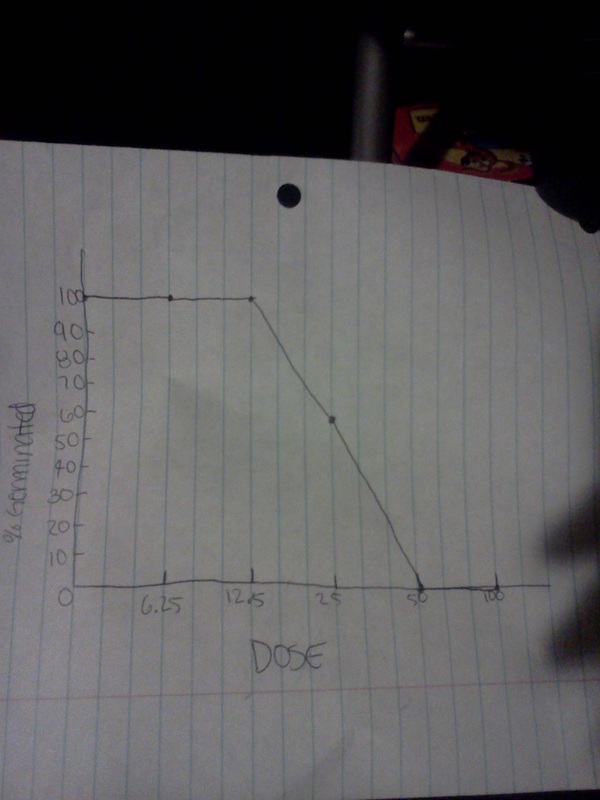
You will measure the response of the radish seeds at various salt concentrations. After the seeds have germinated, count the number of seeds that germinated and measure the length of each radical (embryonic root). After recording your results, you will create two graphs (% seed germination and dose-response curve) to help you analyze the data collected.
VARIABLES
Independent: Salt Concentration
Dependent: Radical Length
Control: 0% Salt Concentration
PROBLEM: Determine how radish seeds will respond to various concentrations of salt.
MATERIALS: .6 petri dishes
6 seeds
12 napkins
Water
Graduated cylinder
Concentrated Salt Water solution
PROCEDURE:
1. Label all six petri dishes with your group number, the dish #, and a percent concentration of chemical:
- Dish #1: 0%
- Dish #2: 6.25%
- Dish #3: 12.5%
- Dish #4: 25%
- Dish #5: 50%
- Dish #6: 100%
- Put two napkins together and cut them so that they fit into the petri dish.
- Put on the safety goggles and latex gloves. Carefully pour the chemical solutions onto the napkins, making sure to match the numbers and concentration percentages of the dish.
- Count out 10 seeds. Carefully place the seeds on the moist napkins in the petri dish.
- Repeat steps 3-5 for the other dishes.
- Place the seed dishes in a stack, lying flat with the seeds up. Put the seeds in the spot designated by your teacher.
You will measure the response of the radish seeds at various salt concentrations. After the seeds have germinated, count the number of seeds that germinated and measure the length of each radical (embryonic root). After recording your results, you will create two graphs (% seed germination and dose-response curve) to help you analyze the data collected.
- Remove the lid of the control dish. Count the number of seeds that germinated. Calculate the percentage of seeds that germinated and record in Table 2. Note: if fewer than 80% of the seeds in this control sample germinate, this indicates a problem with the experiment.
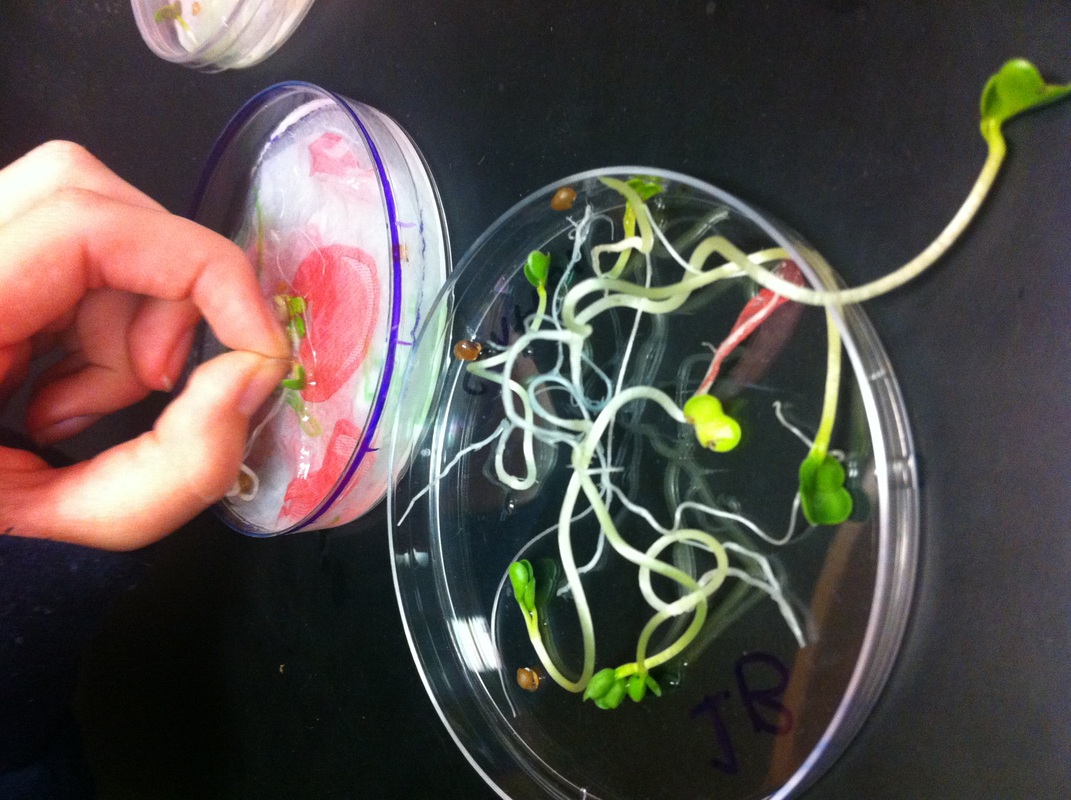
- Measure the length of the radical for each of the germinating lettuce seeds to the nearest millimeter (mm). Look carefully at each sprout to make sure you are measuring just the root, not the shoot as well. In the picture below, you would measure just the part between the two arrows, not the shoot and cotyledons to the left.
- Repeat steps 1-2 for each petri dish.
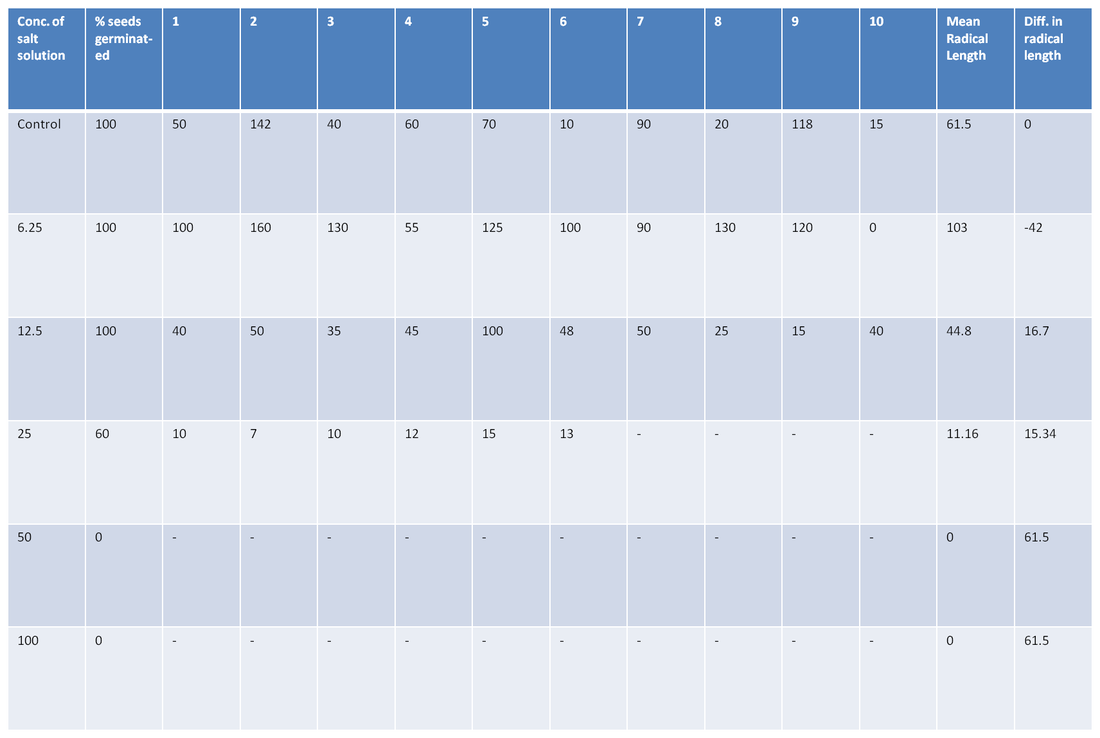
- For each treatment, calculate the mean radical length for each salt solution. Add the total radical lengths for each salt solution and divide by the total number of seeds that germinated. Do not include data from seeds that did not germinate. Record data in column labeled, “Mean Radicle Length (mm).”
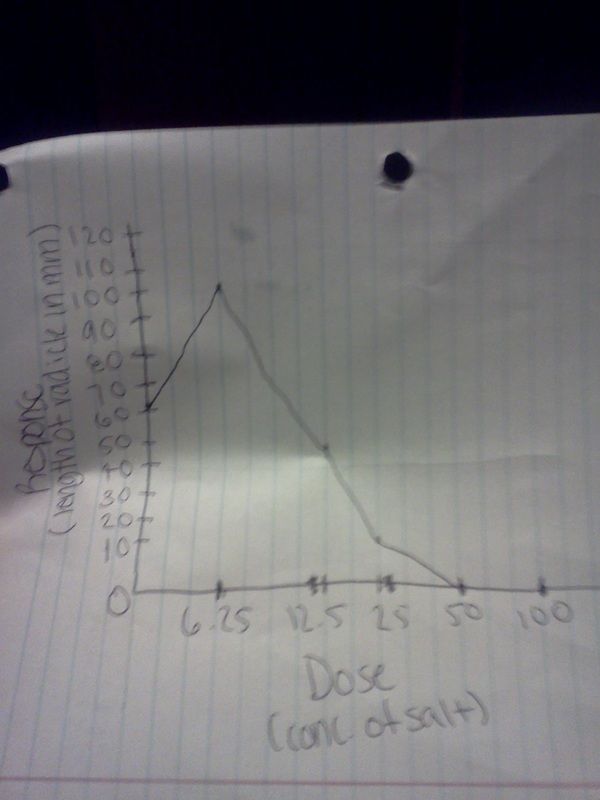
- Make a line graph from the data collected to show a dose-response curve. The horizontal axis should be for the independent variable, dose (concentration of salt solutions). The vertical axis should be for the dependent variable, response (mean radical length). Remember to give the graph a title.
- To help you answer “Did the radical length increase or decrease in length as compared to the control?” subtract the mean radical length of each treatment from the mean radical length of the control. Record your answers in the column, “Difference in Radicle Length” on the data table.
DATA AND OBSERVATIONS:
CONCLUSION QUESTIONS:
1. The LD50 for salt for radish seeds appears to be 25 When the concentration of salt goes halfway through 25 mg/L salt concentration, some seeds did not even germinate. From 50 mg/L to higher, no seeds germinated.
2. My radicle data is supported by the germination data because when more percent of the seeds were germinated, the higher the number was for the radicle length.
GENERAL ANALYSIS:
My hypothesis was mostly true because halfway through 25 mg/L of salt concentration, the seeds didn't germinated, but after 50 mg/L of salt concentration, no seed germinated at all. The assesment of the accuracy of the results is pretty good, but if we gave the seeds more time to germinate, the accuracy would probably be better because it has been more time in the salt concentration. The LD50 lab applies to major ideas of this course because by showing that the LD50 of a certain substance can kill people and shrink the population size.
