Leaf Litter Lab
PRE-LAB QUESTIONS:
1. Why would we want to rate the amount of biodiversity in a location?
To determine if ecosystem is a healthy or unhealthy environment.
2. Examine the charts below and calculate the diversity indices for the three samples.
1. Why would we want to rate the amount of biodiversity in a location?
To determine if ecosystem is a healthy or unhealthy environment.
2. Examine the charts below and calculate the diversity indices for the three samples.
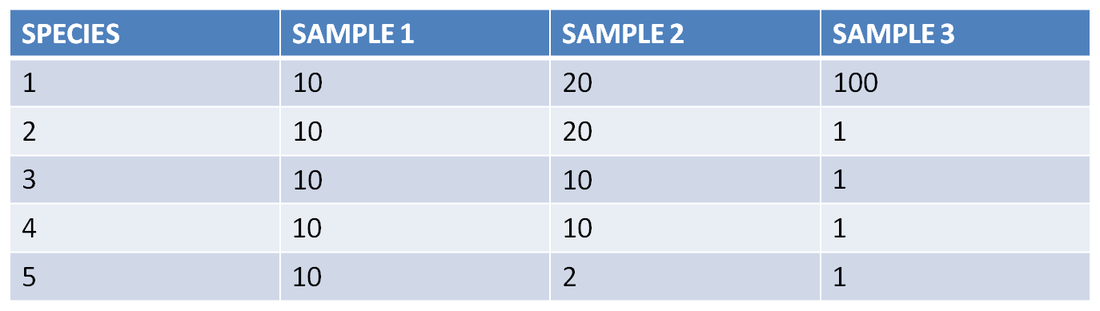
Sample 1: D = 10(9) +10(9) +10(9) +10(9) +10(9) / 50(49)
= 450/2450
= 0.18
index = 1 - 0.18 = 0.82
reciprocal = 1/0.18 = 5.5
Sample 2: D = 20(19)+20(19)+10(9)+10(9)+2(1) / 62(61)
= 942 / 3782
= 0.249
index = 1 - 0.249 = 0.751
reciprocal = 1/0.249= 4.02
Sample 3: D = 100(99)+1(0)+1(0)+1(0)+1(0) / 104(103)
= 9904 / 10712
= 0.925
index = 1 - 0.925 = 0.075
reciprocal = 1/0.925= 1.08
3. Use the results from the previous question to describe the biodiversity of each sample.
The biodiversity for sample 1 and 2 are high while the biodiversity in sample 3 is low because the closer the D is to 1, the lower it is, but if it is closer to 0, the higher it is.
HYPOTHESIS:
The biodiversity in the area is going to be high.
PROBLEM:
What is the biodiversity in the leaf litter in the wooded are near HHS?
Variables:
Independant Variable: Sample location
Dependant Variable: Species diversity
Controlled Variables: Temperature, time, and light
Control Group: Species in room
Experimental Group: Species in forest
Materials:
Compound Microscope
Berless Funnel
Leaf Litter
Alcohol
Source of Light
Procedure
1. Collect a sample of leaf litter. Be sure to collect the entire layer down to the soil.
2. Examine the sample and classify what you see the layer is composed of.
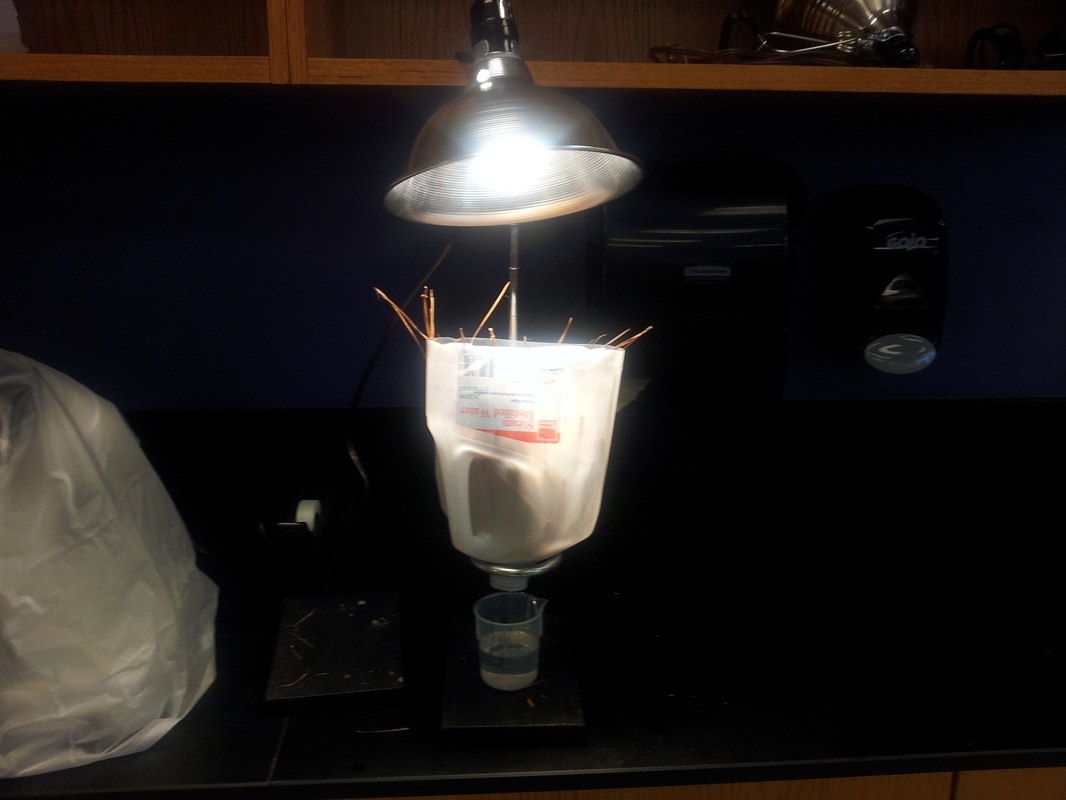
3. Place your sample into the Berlese Funnel under the light source. Place a small beaker of alcohol under the funnel. The hope is that small invertebrates will travel away from the light and fall into your alcohol.
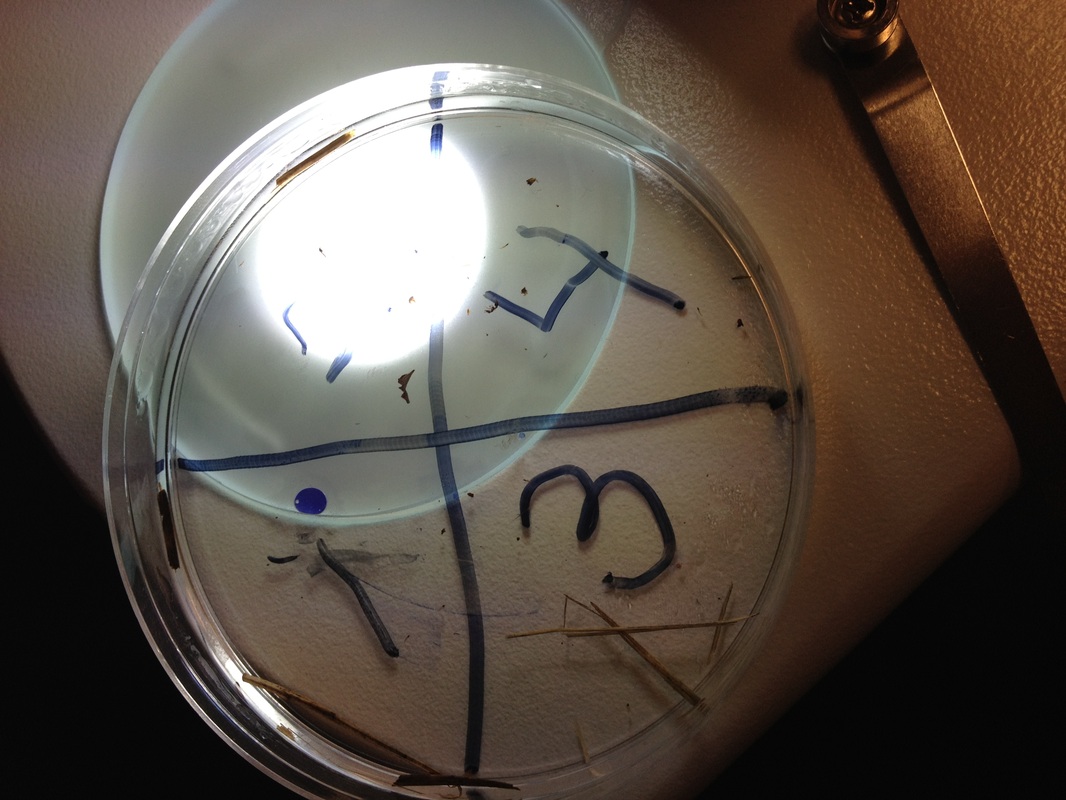
4. The next day, collect your beaker and examine the organisms you have collected under the microscopes. You will need to calculate the number of each species you have, and identify them. Each person may work on a portion of the sample and put your numbers together. Use the Identification pages to name each species.
5. Use the information to calculate the diversity indices for your sample.
Observations
Location: Wake Forest
Type of Community: Deciduous wood forest
Date: September 2012
Time: 1:00pm-2:00pm
Weather description: Clear, sunny, warm
Air temp: Did not check
Soil temp: Did not check
Relative Humidity: Did not check
= 450/2450
= 0.18
index = 1 - 0.18 = 0.82
reciprocal = 1/0.18 = 5.5
Sample 2: D = 20(19)+20(19)+10(9)+10(9)+2(1) / 62(61)
= 942 / 3782
= 0.249
index = 1 - 0.249 = 0.751
reciprocal = 1/0.249= 4.02
Sample 3: D = 100(99)+1(0)+1(0)+1(0)+1(0) / 104(103)
= 9904 / 10712
= 0.925
index = 1 - 0.925 = 0.075
reciprocal = 1/0.925= 1.08
3. Use the results from the previous question to describe the biodiversity of each sample.
The biodiversity for sample 1 and 2 are high while the biodiversity in sample 3 is low because the closer the D is to 1, the lower it is, but if it is closer to 0, the higher it is.
HYPOTHESIS:
The biodiversity in the area is going to be high.
PROBLEM:
What is the biodiversity in the leaf litter in the wooded are near HHS?
Variables:
Independant Variable: Sample location
Dependant Variable: Species diversity
Controlled Variables: Temperature, time, and light
Control Group: Species in room
Experimental Group: Species in forest
Materials:
Compound Microscope
Berless Funnel
Leaf Litter
Alcohol
Source of Light
Procedure
1. Collect a sample of leaf litter. Be sure to collect the entire layer down to the soil.
2. Examine the sample and classify what you see the layer is composed of.
3. Place your sample into the Berlese Funnel under the light source. Place a small beaker of alcohol under the funnel. The hope is that small invertebrates will travel away from the light and fall into your alcohol.
4. The next day, collect your beaker and examine the organisms you have collected under the microscopes. You will need to calculate the number of each species you have, and identify them. Each person may work on a portion of the sample and put your numbers together. Use the Identification pages to name each species.
5. Use the information to calculate the diversity indices for your sample.
Observations
Location: Wake Forest
Type of Community: Deciduous wood forest
Date: September 2012
Time: 1:00pm-2:00pm
Weather description: Clear, sunny, warm
Air temp: Did not check
Soil temp: Did not check
Relative Humidity: Did not check
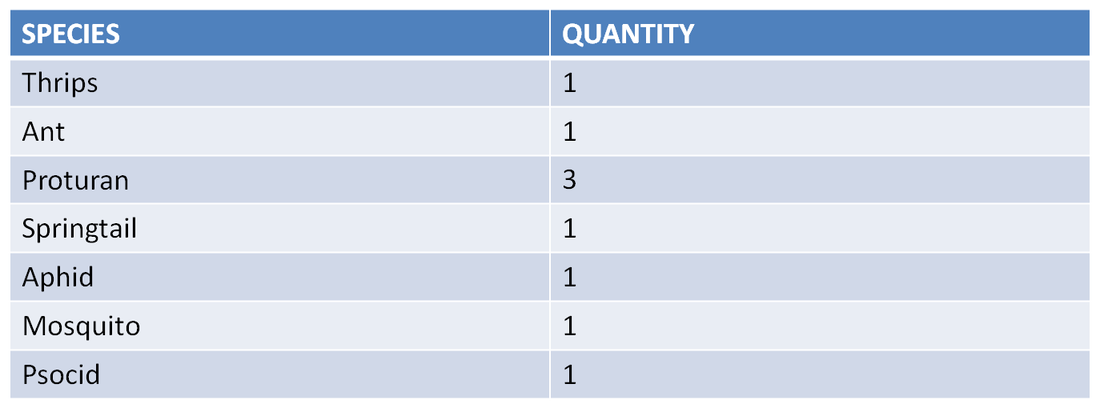
CALCULATIONS:
D = (1)(0)+(1)(0)+(3)(2)+1(0)+(1)(0)+(1)(0)+(1)(0)/ 9(8)
= 0.17
Index = 1 – 0.17 = 0.83
Reciprocal = 1/0.17 = 5.88
Questions:
1. What are two reasons the organisms move away from the light down the funnel? What does this indicate about the organisms?
The organisms moved down the funnel because it's colder and darker. The second reason is that some of them live underground. This indicates that these organisms like the cold.
2. Summarize whether you think the biodiversity of this litter is high or low density. If low, try to give some reasons why this might be.
The biodiversity in this litter is high because our D was .17 according to the Simpson's index.
3. Why would an environmental scientist need to make more than one measurement if he was calculating the biodiversity? How would you take samples of a large forest?
Because the biodiversity is not constant in one area and they need to keep on measuring more. To take samples from a large forest, there would have to be many groups spread out in the forest to take samples.
CONCLUSION:
My hypothesis in this lab was correct because i said there was going to be high biodiversity in the area. The accuracy of this lab could've been more accurate if we had taken more samples of different days in different weather and time. This is an application to the course because it shows how to calculate the biodiversity in a biome.
